List of parliamentary constituencies in Wiltshire

The ceremonial county of Wiltshire, England, (which includes the unitary authority of Swindon), is divided into eight Parliamentary constituencies. They are all County constituencies.[nb 1]
Constituencies
† Conservative ‡ Labour ¤ Liberal Democrat
| Constituency | Electorate[1] | Majority[2] | Member of Parliament[2] | Nearest opposition[2] | Map | ||
|---|---|---|---|---|---|---|---|
| Chippenham CC | 72,492 | 8,138 | Sarah Gibson¤ | Nic Puntis† |  | ||
| East Wiltshire CC | 72,409 | 4,716 | Danny Kruger† | Rob Newman‡ |  | ||
| Melksham and Devizes CC | 71,999 | 2,401 | Brian Mathew¤ | Michelle Donelan† |  | ||
| Salisbury CC | 70,281 | 3,807 | John Glen† | Matt Aldridge‡ |  | ||
| South Cotswolds CC (part) | 71,490 | 4,973 | Roz Savage¤ | James Gray† |  | ||
| South West Wiltshire CC | 71,574 | 3,243 | Andrew Murrison† | Evelyn Akoto† |  | ||
| Swindon North CC | 73,238 | 4,103 | Will Stone‡ | Justin Tomlinson† |  | ||
| Swindon South CC | 72,596 | 9,606 | Heidi Alexander‡ | Robert Buckland† |  | ||
Boundary changes
2024
See 2023 Periodic Review of Westminster constituencies for further details.
Following the abandonment of the Sixth Periodic Review (the 2018 review), the Boundary Commission for England formally launched the 2023 Review on 5 January 2021.[3] Initial proposals were published on 8 June 2021 and, following two periods of public consultation, revised proposals were published on 8 November 2022. The final proposals were published on 28 June 2023.
The commission proposed that Wiltshire be combined with Gloucestershire as a sub-region of the South West Region, with the creation of the cross-county boundary constituency of South Cotswolds, resulting in a major reconfiguration of Chippenham. Devizes and North Wiltshire were abolished and new constituencies named East Wiltshire, and Melksham and Devizes, created.[4][5] These changes came into effect for the 2024 general election.
The following seats were proposed:
Containing electoral wards in Swindon
- East Wiltshire (part)
- Swindon North
- Swindon South
Containing electoral wards in Wiltshire (unitary authority)
- Chippenham
- East Wiltshire (part)
- Melksham and Devizes
- Salisbury
- South Cotswolds (parts also in the Districts of Cotswold and Stroud in Gloucestershire)
- South West Wiltshire
2010
Under the Fifth Periodic Review of Westminster constituencies, the Boundary Commission for England decided to increase the number of seats in Wiltshire from 6 to 7, with the re-establishment of Chippenham, which impacted on neighbouring constituencies. An adjusted Westbury constituency was renamed South West Wiltshire.
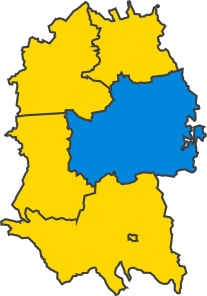
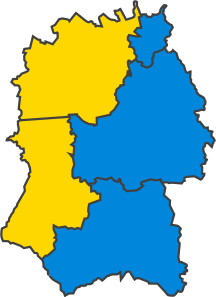
| Former name | Boundaries 1997-2010 | Current name | Boundaries 2014–present |
|---|---|---|---|
|  |
|  |
Results history
Primary data source: House of Commons research briefing - General election results from 1918 to 2019[6]
2024
The number of votes cast for each political party who fielded candidates in constituencies comprising Wiltshire in the 2024 general election were as follows:[nb 2][2]
| Party | Votes | % | Change from 2019 | Seats | Change from 2019 |
|---|---|---|---|---|---|
| Conservative | 125,505 | 32.6% |  25.2% 25.2% | 3 | 4 |
| Liberal Democrats | 96,677 | 25.1% |  6.5% 6.5% | 3 | 3 |
| Labour | 89,880 | 23.3% | 3.2% | 2 | 2 |
| Reform | 52,755 | 13.7% | New | 0 | New |
| Greens | 16,864 | 4.4% | 1.1% | 0 | 0 |
| Others | 3,849 | 1.0% | 0.4% | 0 | 0 |
| Total | 385,530 | 100.0 | 8 |
2019
The number of votes cast for each political party who fielded candidates in constituencies comprising Wiltshire in the 2019 general election were as follows:
| Party | Votes | % | Change from 2017 | Seats | Change from 2017 |
|---|---|---|---|---|---|
| Conservative | 217,955 | 57.8% | 1.0% | 7 | 0 |
| Labour | 77,343 | 20.1% | 6.9% | 0 | 0 |
| Liberal Democrats | 69,876 | 18.6% | 6.7% | 0 | 0 |
| Greens | 11,378 | 3.3% | 1.2% | 0 | 0 |
| Others | 745 | 0.6% | 2.0% | 0 | 0 |
| Total | 377,297 | 100.0 | 7 |
Percentage votes
| Election year | 1918 | 1922 | 1923 | 1924 | 1929 | 1931 | 1935 | 1945 | 1950 | 1951 | 1955 | 1959 | 1964 | 1966 | 1970 | 1974 (Feb) | 1974 (Oct) | 1979 | 1983 | 1987 | 1992 | 1997 | 2001 | 2005 | 2010 | 2015 | 2017 | 2019 | 2024 |
|---|---|---|---|---|---|---|---|---|---|---|---|---|---|---|---|---|---|---|---|---|---|---|---|---|---|---|---|---|---|
| Conservative | 52.8 | 50.0 | 45.7 | 53.9 | 43.2 | 60.7 | 56.2 | 41.6 | 41.0 | 50.1 | 49.6 | 49.3 | 43.2 | 43.8 | 51.0 | 41.9 | 40.3 | 47.4 | 50.3 | 51.9 | 50.9 | 40.2 | 42.1 | 44.3 | 47.7 | 52.4 | 56.8 | 57.8 | 32.6 |
| Liberal Democrat1 | 30.1 | 34.6 | 42.9 | 30.4 | 34.8 | 19.1 | 19.8 | 18.4 | 19.6 | 3.7 | 8.7 | 10.7 | 18.9 | 15.2 | 11.7 | 29.8 | 30.2 | 27.5 | 34.2 | 31.2 | 28.7 | 26.2 | 25.0 | 26.9 | 30.4 | 11.8 | 11.8 | 18.5 | 25.1 |
| Labour | 17.1 | 15.4 | 11.4 | 15.7 | 21.9 | 20.2 | 24.0 | 39.9 | 39.2 | 46.2 | 41.7 | 38.7 | 37.5 | 40.6 | 37.2 | 28.1 | 29.3 | 22.8 | 14.9 | 16.7 | 18.3 | 28.0 | 29.0 | 24.3 | 15.3 | 17.3 | 27.4 | 20.5 | 23.3 |
| Reform | - | - | - | - | - | - | - | - | - | - | - | - | - | - | - | - | - | - | - | - | - | - | - | - | - | - | - | - | 13.7 |
| Green Party | - | - | - | - | - | - | - | - | - | - | - | - | - | - | - | - | - | - | - | * | * | * | * | * | 1.0 | 4.7 | 1.8 | 3.0 | 4.4 |
| UKIP | - | - | - | - | - | - | - | - | - | - | - | - | - | - | - | - | - | - | - | - | - | * | * | * | 4.0 | 13.5 | 1.8 | * | - |
| Other | - | - | - | - | - | - | - | - | 0.1 | - | - | 1.3 | 0.4 | 0.4 | 0.2 | 0.3 | 0.2 | 2.2 | 0.7 | 0.1 | 2.2 | 5.6 | 3.9 | 4.5 | 1.6 | 0.4 | 0.4 | 0.2 | 1.0 |
1pre-1979 - Liberal Party; 1983 & 1987 - SDP-Liberal Alliance
* Included in Other
Seats
| Election year | 1950 | 1951 | 1955 | 1959 | 1964 | 1966 | 1970 | 1974 (Feb) | 1974 (Oct) | 1979 | 1983 | 1987 | 1992 | 1997 | 2001 | 2005 | 2010 | 2015 | 2017 | 2019 | 2024 |
|---|---|---|---|---|---|---|---|---|---|---|---|---|---|---|---|---|---|---|---|---|---|
| Conservative | 4 | 4 | 4 | 4 | 4 | 4 | 4 | 4 | 4 | 4 | 5 | 5 | 5 | 4 | 4 | 4 | 6 | 7 | 7 | 7 | 3 |
| Liberal Democrat1 | 0 | 0 | 0 | 0 | 0 | 0 | 0 | 0 | 0 | 0 | 0 | 0 | 0 | 0 | 0 | 0 | 1 | 0 | 0 | 0 | 3 |
| Labour | 1 | 1 | 1 | 1 | 1 | 1 | 1 | 1 | 1 | 1 | 0 | 0 | 0 | 2 | 2 | 2 | 0 | 0 | 0 | 0 | 2 |
| Total | 5 | 5 | 5 | 5 | 5 | 5 | 5 | 5 | 5 | 5 | 5 | 5 | 5 | 6 | 6 | 6 | 7 | 7 | 7 | 7 | 8 |
11974 & 1979 - Liberal Party; 1983 & 1987 - SDP-Liberal Alliance
Maps
1885-1910
-
 1885
1885 -
 1886
1886 -
 1892
1892 -
 1895
1895 -
 1900
1900 -
 1906
1906 -
 Jan 1910
 - Dec 1910


1918-1945
-
 1918
1918 -
 1922
1922 -
 1923
1923 - 1924
-
 1929
1929 - 1931
- 1935
- 1945


1950-1979
-
 1950
1950 - 1951
- 1955
- 1959
- 1964
- 1966
- 1970
-
 1974 Feb
 - 1974 Oct
- 1979


1983-present
-
 1983
1983 - 1987
- 1992
-
 1997
1997 - 2001
- 2005
-
 2010
2010 -
 2015
2015 - 2017
- 2019


Historical representation by party
A cell marked → (with a different colour background to the preceding cell) indicates that the previous MP continued to sit under a new party name.
1885 to 1918 (6 seats)
Conservative Liberal Liberal Unionist
| Constituency | 1885 | 1886 | 1892 | 1895 | 97 | 98 | 00 | 1900 | 05 | 1906 | Jan 1910 | Dec 1910 | 11 | 18 |
|---|---|---|---|---|---|---|---|---|---|---|---|---|---|---|
| Cricklade | Maskelyne | → | Husband | Hopkinson | FitzMaurice | Massie | Calley | Lambert | ||||||
| Chippenham | Fletcher | Bruce | Dickson-Poynder | → | Terrell | |||||||||
| Devizes | Long | Hobhouse | Goulding | Rogers | Peto | |||||||||
| Salisbury | Grenfell | Hulse | Allhusen | Palmer | Tennant | Locker-Lampson | ||||||||
| Westbury | Fuller | Chaloner | Fuller | Howard | ||||||||||
| Wilton | Grove | → | Pleydell-Bouverie | J. Morrison | Morse | Bathurst | H. Morrison | |||||||
1918 to 1974 (5 seats)
Conservative Labour Liberal
| Constituency | 1918 | 1922 | 1923 | 1924 | 27 | 1929 | 31 | 1931 | 34 | 1935 | 42 | 43 | 1945 | 1950 | 1951 | 1955 | 1959 | 62 | 64 | 1964 | 65 | 1966 | 69 | 1970 |
|---|---|---|---|---|---|---|---|---|---|---|---|---|---|---|---|---|---|---|---|---|---|---|---|---|
| Chippenham | Terrell | Bonwick | Cazalet | Eccles | Awdry | |||||||||||||||||||
| Westbury | Palmer | Darbishire | Shaw | Long | Grimston | Walters | ||||||||||||||||||
| Devizes | Bell | Macfadyen | Hurd | Hollis | Pott | C. Morrison | ||||||||||||||||||
| Salisbury | H. Morrison | Moulton | H. Morrison | Despencer-Robertson | J. Morrison | Hamilton | ||||||||||||||||||
| Swindon | Young | Banks | Addison | Banks | Addison | Wakefield | Reid | Noel-Baker | Ward | Stoddart | ||||||||||||||
1974 to 2010 (5, then 6 seats)
Conservative Labour Liberal Democrats
| Constituency | Feb 1974 | Oct 1974 | 1979 | 1983 | 1987 | 1992 | 1997 | 2001 | 2005 |
|---|---|---|---|---|---|---|---|---|---|
| Chippenham / N Wiltshire (1983) | Awdry | Needham | Gray | ||||||
| Devizes | Morrison | Ancram | |||||||
| Salisbury | Hamilton | Key | |||||||
| Westbury | Walters | Faber | Murrison | ||||||
| Swindon / South Swindon (1997) | Stoddart | Coombs | Drown | Snelgrove | |||||
| North Swindon | Wills | ||||||||
2010 to present (7, then 7.5 seats)
Conservative Labour Liberal Democrats
| Constituency | 2010 | 2015 | 2017 | 2019 | 2024 |
|---|---|---|---|---|---|
| Chippenham | Hames | Donelan | Gibson | ||
| Devizes / East Wiltshire (2024) | Perry | Kruger | |||
| North Wiltshire / South Cotswolds* (2024) | Gray | Savage | |||
| Salisbury | Glen | ||||
| South West Wiltshire | Murrison | ||||
| Swindon North | Tomlinson | Stone | |||
| Swindon South | Buckland | Alexander | |||
| Melksham and Devizes | Mathew | ||||
*half of the seat lies in Gloucestershire
See also
Notes
- ^ South Cotswolds is a cross-county boundary constituency between Wiltshire and Gloucestershire.
- ^ It should be acknowledged that South Cotswolds is a cross-county constituency between Wiltshire and Gloucestershire. As the results of UK general elections are not disclosed on a sub-constituency level, the following vote shares contain parts of the electorate in the Cotswold and Stroud districts.
References
- ^ "The 2023 Review of Parliamentary Constituency Boundaries in England - Volume two: Constituency names, designations and composition - South West". Boundary Commission for England. Retrieved 9 July 2024.
- ^ a b c d "UK Election A-Z Constituencies 2024". BBC News. Retrieved 9 July 2024.
- ^ "2023 Review | Boundary Commission for England". boundarycommissionforengland.independent.gov.uk. Retrieved 7 October 2021.
- ^ "Drastic election boundary changes proposed for Wiltshire". Wiltshire Times. Retrieved 8 October 2021.
- ^ "The 2023 Review of Parliamentary Constituency Boundaries in England – Volume one: Report | Boundary Commission for England". boundarycommissionforengland.independent.gov.uk. paras 1084-1126. Retrieved 10 July 2023.
- ^ Watson, Christopher; Uberoi, Elise; Loft, Philip (17 April 2020). "General election results from 1918 to 2019".
{{cite journal}}: Cite journal requires|journal=(help)
1. https://www.bbc.co.uk/news/politics/constituencies 2.http://geo.digiminster.com/election/2015-05-07/Search?Query=wiltshire
- v
- t
- e
- Avon
- Bedfordshire
- Berkshire
- Buckinghamshire
- Cambridgeshire
- Cheshire
- Cleveland
- Cornwall
- Cumbria
- Derbyshire
- Devon
- Dorset
- Durham
- Essex
- Gloucestershire
- Greater Manchester
- Hampshire
- Herefordshire and Worcestershire
- Hertfordshire
- Humberside
- Isle of Wight
- Kent
- Lancashire
- Leicestershire and Rutland
- Lincolnshire
- London
- Merseyside
- Norfolk
- Northamptonshire
- Northumberland
- Nottinghamshire
- Oxfordshire
- Shropshire
- Somerset
- Staffordshire
- Suffolk
- Surrey
- East Sussex
- West Sussex
- Tyne and Wear
- Warwickshire
- West Midlands
- Wiltshire
- North Yorkshire
- South Yorkshire
- West Yorkshire
- Huntingdonshire
- Middlesex
- Westmorland
- (1801–1832)
- (1832–1868)
- (1868–1885)
- (1885–1918)
- (1918–1945)
- (1950–1974)
- (1974–1983)
- (1983–1997)
- (1997–2024)
- (2024–present)


