2013 UK local government election
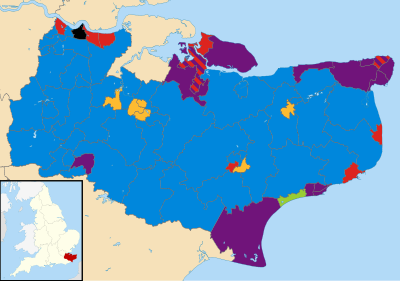
The Kent County Council election, 2013 was an election to all 84 seats on Kent County Council held on Thursday 2 May as part of the 2013 United Kingdom local elections. 84 councillors were elected from 72 electoral divisions, which returned either one or two county councillors each by first-past-the-post voting for a four-year term of office. The electoral divisions were the same as those used at the previous election in 2009. No elections were held in Medway, which is a unitary authority outside the area covered by the County Council. The election saw the Conservative Party narrowly retain overall control of the council.[1]
All locally registered electors (British, Irish, Commonwealth and European Union citizens) who were aged 18 or over on Thursday 2 May 2013 were entitled to vote in the local elections. Those who were temporarily away from their ordinary address (for example, away working, on holiday, in student accommodation or in hospital) were also entitled to vote in the local elections,[2] although those who had moved abroad and registered as overseas electors cannot vote in the local elections. It is possible to register to vote at more than one address (such as a university student who had a term-time address and lives at home during holidays) at the discretion of the local Electoral Register Office, but it remains an offence to vote more than once in the same local government election.[3]
Summary
The Conservative Party retained overall control of the council, winning 44 of the 84 seats on the council. This was a reduction of 30 seats from the party's 2009 performance, where the local party held all but 10 of the 84 seats.
UKIP came second in terms of councillors with 17 seats (including one defection from the Conservatives prior to the election), the party is now the council's official opposition with Roger Latchford as their leader. UKIP capitalised on their strong national opinion poll performances and Parliamentary by-election results, winning their first representation on the council.[4] Labour Party candidates made substantial gains, rising from 3 to 13 seats and finishing in third place in the election. Despite local Liberal Democrats winning the same number of seats as in 2009, they are no longer the official opposition, having slipped to become the fourth-largest party in the Maidstone County Hall chamber.
The Green Party won their first seat on the council, for the Hythe division.
The Swanscombe and Greenhithe division was held by the incumbent independent councillor, who gained the seat in 2009.
Results
Kent County Council election, 2013 | Party | Seats | Gains | Losses | Net gain/loss | Seats % | Votes % | Votes | +/− |
| | Conservative | 44 | 0 | 27 | -27 | 52.38 | 35.47 | 141,192 | |
| | UKIP | 17 | 16 | 0 | +16 | 20.24 | 25.83 | 102,813 | |
| | Labour | 13 | 11 | 1 | +10 | 15.48 | 22.59 | 89,935 | |
| | Liberal Democrats | 7 | 1 | 1 | 0 | 8.33 | 9.35 | 37,214 | |
| | Green | 1 | 1 | 0 | +1 | 1.19 | 3.65 | 14,531 | |
| | Swanscombe and Greenhithe Residents Association | 1 | 0 | 0 | 0 | 1.19 | 0.17 | 673 | |
| | Independent | 0 | 0 | 0 | 0 | 0 | 1.24 | 4,929 | |
| | English Democrat | 0 | 0 | 0 | 0 | 0 | 0.87 | 3,465 | |
| | No Description | 0 | 0 | 0 | 0 | 0 | 0.45 | 1,780 | |
| | TUSC | 0 | 0 | 0 | 0 | 0 | 0.11 | 439 | |
| | New England | 0 | 0 | 0 | 0 | 0 | 0.08 | 312 | |
| | Ashford Independent | 0 | 0 | 0 | 0 | 0 | 0.07 | 281 | |
| | Official Monster Raving Loony Party | 0 | 0 | 0 | 0 | 0 | 0.05 | 215 | |
Council Composition
Prior to the election the composition of the council was:
↓ | 74 | 7 | 2 | 1 |
| Conservative | LD | Lab | R |
After the election the composition of the council was:
↓ | 45 | 17 | 13 | 7 | 1 | 1 |
| Conservative | UKIP | Labour | LD | G | R |
LD - Liberal Democrats
G - Green Party
R - Residents Association
Results by district
Kent is divided into 12 regions: Ashford, Canterbury, Dartford, Dover, Gravesham, Maidstone, Sevenoaks, Folkestone and Hythe, Swale, Thanet, Tonbridge and Malling, and Tunbridge Wells.
Ashford
There are seven single-member constituencies within the borough of Ashford. Below are the results:[5]
Ashford Central | Party | Candidate | Votes | % | ±% |
| | Conservative | Jim Wedgbury | 1,170 | 37 | -17 |
| | UKIP | Norman Taylor | 913 | 29 | N/A |
| | Labour | Dara Farrell | 532 | 17 | +4 |
| | Green | Steven Robert Campkin | 273 | 9 | -6 |
| | Liberal Democrats | Chris Took | 238 | 8 | -10 |
| Majority | 257 | 8 | |
| Turnout | 3,126 | 26 | -7 |
| | Conservative hold | Swing | | |
Ashford East | Party | Candidate | Votes | % | ±% |
| | Liberal Democrats | Georgie Joseph Serge Koowaree | 972 | 28 | -28 |
| | UKIP | Elaine Evans | 827 | 24 | N/A |
| | Conservative | Richard Bunting | 787 | 23 | -11 |
| | Labour | Harriet Bronwen Yeo | 444 | 13 | +3 |
| | Ashford Independent | Tony Bartlett | 295 | 9 | N/A |
| | Green | Mandy Rossi | 143 | 4 | N/A |
| Majority | 145 | 4 | |
| Turnout | 3,468 | 27 | -8 |
| | Liberal Democrats hold | Swing | | |
Ashford Rural East | Party | Candidate | Votes | % | ±% |
| | Conservative | Andrew Wickham | 1,741 | 44 | -14 |
| | UKIP | Eddy Barrows | 995 | 25 | N/A |
| | Labour | Tom Reed | 421 | 11 | +4 |
| | Green | Geoff Meaden | 333 | 8 | -10 |
| | Liberal Democrats | Ken Blanshard | 241 | 6 | -11 |
| | Independent | Jack Woodford | 226 | 6 | N/A |
| Majority | 746 | 19 | |
| Turnout | 3,957 | 33 | -9 |
| | Conservative hold | Swing | | |
Ashford Rural South | Party | Candidate | Votes | % | ±% |
| | Conservative | Mike Angell | 1,378 | 41 | -16 |
| | UKIP | Ann Taylor | 1,095 | 32 | N/A |
| | Labour | Vivien Wheatley | 482 | 14 | +5 |
| | Green | Marilyn Sansom | 195 | 6 | -8 |
| | Liberal Democrats | John Bullivant Mackie | 175 | 5 | -15 |
| | BNP | Michael Barry Hook | 48 | 1 | N/A |
| Majority | 283 | 9 | |
| Turnout | 3,373 | 25 | -12 |
| | Conservative hold | Swing | | |
Ashford Rural West | Party | Candidate | Votes | % | ±% |
| | Conservative | Charlie Simkins | 1,872 | 44 | -21 |
| | UKIP | Pat Purnell | 1,367 | 32 | N/A |
| | Labour | Waheed Qureshi | 371 | 9 | +2 |
| | Green | Hilary Jones | 328 | 8 | -6 |
| | Liberal Democrats | Clare Hardwick | 326 | 8 | -6 |
| Majority | 505 | 12 | |
| Turnout | 4,264 | 28 | -13 |
| | Conservative hold | Swing | | |
Ashford South | Party | Candidate | Votes | % | ±% |
| | Labour | Derek Smyth | 1,026 | 37 | +11 |
| | UKIP | Victoria Angharad Frances Yeo | 827 | 30 | N/A |
| | Conservative | Larry Krause | 486 | 18 | -16 |
| | Liberal Democrats | Adrian John Gee-Turner | 290 | 11 | -10 |
| | Green | Tom Phillip Harry Medhurst | 118 | 4 | -3 |
| Majority | 299 | 7 | |
| Turnout | 2,747 | 23 | -8 |
| | Labour gain from Conservative | Swing | | |
Tenterden | Party | Candidate | Votes | % | ±% |
| | Conservative | Mike Hill | 2,074 | 51 | -19 |
| | UKIP | Robert Charles Dobson | 1,211 | 30 | N/A |
| | Labour | Alex Ward | 308 | 8 | ±0 |
| | Green | Matt Stanley | 292 | 7 | N/A |
| | Liberal Democrats | Stuart James Dove | 196 | 5 | -17 |
| Majority | 863 | 21 | |
| Turnout | 4,081 | 34 | -8 |
| | Conservative hold | Swing | | |
There are five single-member and two multi-member constituencies within the City of Canterbury, which elect a total of nine councilors to Kent County Council. Below are the results:[6]
Canterbury City North East | Party | Candidate | Votes | % | ±% |
| | Conservative | Graham Kenneth Gibbens | 1,207 | 43 | -2 |
| | Labour | Mike Bland | 768 | 27 | +17 |
| | UKIP | Jim Gascoyne | 384 | 14 | N/A |
| | Liberal Democrats | Martin Ashton | 234 | 8 | -25 |
| | Green | Russell John Charles Page | 213 | 8% | -4 |
| Majority | 439 | 16 | |
| Turnout | 2,806 | 24 | -13 |
| | Conservative hold | Swing | | |
Canterbury City South West | Party | Candidate | Votes | % | ±% |
| | Liberal Democrats | Martin Vye | 1,555 | 43 | -6 |
| | Conservative | Jeremy Paul Bellamy | 563 | 15 | -12 |
| | UKIP | David Kenneth Charles Perry | 562 | 15 | N/A |
| | Labour | Howard Robert Rowles | 526 | 15 | +6 |
| | Green | Jo Kidd | 439 | 12 | -3 |
| Majority | 992 | 28 | |
| Turnout | 3,648 | 29 | -9 |
| | Liberal Democrats hold | Swing | | |
Canterbury South East | Party | Candidate | Votes | % | ±% |
| | Conservative | Michael John Northey | 1,385 | 33 | -13 |
| | Liberal Democrats | Michael John Sole | 1,181 | 28 | -6 |
| | UKIP | Oliver John Kent | 795 | 19 | N/A |
| | Labour | Jean Elizabeth Butcher | 549 | 13 | +6 |
| | Green | Emily Edith Shirley | 294 | 7 | -6 |
| Majority | 204 | 5 | |
| Turnout | 4,204 | 31 | -13 |
| | Conservative hold | Swing | | |
Canterbury West | Party | Candidate | Votes | % | ±% |
| | Conservative | John David Simmonds | 1,067 | 38 | -12 |
| | UKIP | David Joseph De Boick | 633 | 22 | N/A |
| | Labour | Carol Goldstein | 496 | 18 | +9 |
| | Liberal Democrats | Dan Smith | 383 | 14 | -9 |
| | Green | Steel James Horton | 236 | 8 | -10 |
| Majority | 434 | 16 | |
| Turnout | 2,815 | 23 | -13 |
| | Conservative hold | Swing | | |
Herne and Sturry | Party | Candidate | Votes | % | ±% |
| | Conservative | Alan Marsh | 1,452 | 41 | -6 |
| | UKIP | Sarah Larkins | 1,086 | 31 | +7 |
| | Labour | Alan Stanley Holden | 590 | 17 | +6 |
| | Green | Elisa Anne De Vert | 217 | 6 | N/A |
| | Liberal Democrats | Nigel Philip Whitburn | 169 | 5 | -13 |
| Majority | 366 | 10 | |
| Turnout | 3,514 | 27 | -8 |
| | Conservative hold | Swing | | |
Herne Bay (2 Seats) | Party | Candidate | Votes | % | ±% |
| | UKIP | Brian Eric MacDowall | 2,054 | 17 | +8 |
| | UKIP | Nicholas James Bond | 2,048 | 17 | N/A |
| | Conservative | Jean Law | 1,817 | 15 | -4 |
| | Conservative | David Alan Hirst | 1,724 | 14 | -5 |
| | Labour | Lynn Faux-Bowyer | 1,003 | 8 | +4 |
| | Labour | Tom Mellish | 948 | 8 | +5 |
| | Independent | Steve Coombes | 509 | 4 | N/A |
| | Independent | John David Moore | 484 | 4 | N/A |
| | Liberal Democrats | Margaret Grace Flaherty | 434 | 3 | -12 |
| | Independent | Stanley Truelove | 362 | 3 | N/A |
| | Liberal Democrats | June Rose Raybaud | 308 | 2 | -10 |
| | Green | Elaine Margaret Godden | 242 | 2 | -2 |
| | Green | Michael Peter Coppin | 202 | 2 | N/A |
| | New England | Mike Tibby | 193 | 2 | N/A |
| | New England | Nathan King | 119 | 1 | N/A |
| Majority | 231 | 2 | |
| Turnout | 12,409 | 28 | -8 |
| | UKIP gain from Conservative | Swing | | |
| | UKIP gain from Conservative | Swing | | |
Whitstable (2 Seats) | Party | Candidate | Votes | % | ±% |
| | Conservative | Mark Charles Dance | 2,732 | 17 | -9 |
| | Conservative | Mike Harrison | 2,666 | 17 | -8 |
| | UKIP | Mike Bull | 2,476 | 16 | N/A |
| | UKIP | Howard Malcolm Farmer | 2,435 | 15 | N/A |
| | Labour | James Christopher Cornell | 1,813 | 11 | +4 |
| | Labour | Rita O' Brien | 1,781 | 11 | +4 |
| | Green | Jolyon Loch Trimingham | 600 | 4 | -7 |
| | Green | Pat Marsh | 566 | 4 | N/A |
| | Liberal Democrats | Jonathan Dearth | 529 | 3 | -8 |
| | Liberal Democrats | Kevin Michael Peter McNamara | 344 | 2 | -8 |
| Majority | 190 | 1 | |
| Turnout | 15,942 | 32 | -8 |
| | Conservative hold | Swing | | |
| | Conservative hold | Swing | | |
There are six single-member constituencies within the borough of Dartford. Below are the results:[7]
Dartford East | Party | Candidate | Votes | % | ±% |
| | Conservative | Penny Cole | 942 | 37 | -1 |
| | Labour | Patrick Kelly | 885 | 35 | +9 |
| | UKIP | Ivan Paul Burch | 628 | 25 | N/A |
| | English Democrat | Teresa Cannon | 99 | 4 | -20 |
| Majority | 57 | 2 | |
| Turnout | 2554 | 26 | -8 |
| | Conservative hold | Swing | | |
Dartford North East | Party | Candidate | Votes | % | ±% |
| | Labour Co-op | Tom Maddison | 1,267 | 42 | +13 |
| | Conservative | Avtar Sandhu | 1,088 | 36 | +6 |
| | UKIP | Shan-E-Din Choycha | 552 | 18 | N/A |
| | BNP | Ronald David Ball | 111 | 4 | +5 |
| Majority | 179 | 6 | |
| Turnout | 3,018 | 26 | -8 |
| | Labour Co-op gain from Conservative | Swing | | |
Dartford Rural | Party | Candidate | Votes | % | ±% |
| | Conservative | Jeremy Allan Kite, MBE | 2,067 | 53 | -3 |
| | UKIP | Karl Smith | 990 | 26 | N/A |
| | Labour | David John Baker | 688 | 18 | +6 |
| | English Democrat | Steve Culliford | 136 | 4 | -16 |
| Majority | 1077 | 27 | |
| Turnout | 3,881 | 31 | -9 |
| | Conservative hold | Swing | | |
Dartford West | Party | Candidate | Votes | % | ±% |
| | Conservative | Jan Ozog | 1,560 | 41 | -8 |
| | UKIP | Jo Shippam | 1,112 | 29 | N/A |
| | Labour | John Patrick Burden | 1,095 | 28 | N/A |
| | English Democrat | Milly Uncles | 84 | 2 | +31 |
| Majority | 448 | 12 | |
| Turnout | 3,851 | 29 | -10 |
| | Conservative hold | Swing | | |
Swanscombe and Greenhithe | Party | Candidate | Votes | % | ±% |
| | Swanscombe and Greenhithe Residents Association | Peter Martin Harman | 673 | 27 | -10 |
| | Conservative | Keith Martin Kelly | 650 | 26 | 0 |
| | Labour Co-op | Val Ashenden | 567 | 23 | +11 |
| | UKIP | Stephen Wilders | 528 | 21 | N/A |
| | BNP | Michael Godfrey Cope | 49 | 2 | -9 |
| | English Democrat | Charlie Wood | 42 | 2 | -6 |
| Majority | 23 | 1 | |
| Turnout | 2,509 | 21 | -9 |
| | Residents hold | Swing | | |
Wilmington | Party | Candidate | Votes | % | ±% |
| | Conservative | Ann Allen | 1,790 | 49 | -7 |
| | UKIP | Gary Paul Rogers | 891 | 24 | N/A |
| | Labour | Mark Andrew Maddison | 862 | 23 | +4 |
| | English Democrat | Di Settle | 128 | 3 | -22 |
| Majority | 899 | 25 | |
| Turnout | 3,671 | 28 | -11 |
| | Conservative hold | Swing | | |
There are three single-member and two multi-member constituencies within the District of Dover, which elect a total of seven councillors to Kent County Council. Below are the results:[8]
Deal (2 Seats) | Party | Candidate | Votes | % | ±% |
| | Labour | Mick Eddy | 2,983 | 21 | +8 |
| | Labour | Eileen Rowbotham | 2,881 | 20 | +6 |
| | Conservative | Trevor Antony Bond | 2,670 | 19 | -3 |
| | Conservative | Adrian Friend | 2,564 | 18 | -3 |
| | UKIP | Peter Ripley | 2,081 | 15 | N/A |
| | Liberal Democrats | Robin Charles Hook | 587 | 4 | -11 |
| | Liberal Democrats | Sarah Smith | 465 | 3 | -11 |
| Majority | 211 | 1 | |
| Turnout | 14,231 | 34 | -7 |
| | Labour hold | Swing | | |
| | Labour hold | Swing | | |
Dover North | Party | Candidate | Votes | % | ±% |
| | Conservative | Steve Manion | 2,034 | 45 | +2 |
| | Labour | Linda Anne Keen | 1,630 | 36 | +12 |
| | Independent | Paul McMullan | 579 | 13 | N/A |
| | Liberal Democrats | Linda Anne Hook | 309 | 7 | -7 |
| Majority | 404 | 9 | |
| Turnout | 4,552 | 36 | -8 |
| | Conservative hold | Swing | | |
Dover Town (2 Seats) | Party | Candidate | Votes | % | ±% |
| | Labour | Pam Brivio | 2,353 | 23 | +8 |
| | Labour | Gordon Cowan | 2,195 | 21 | +7 |
| | UKIP | Peter John Myers | 1,850 | 18 | N/A |
| | | Nigel Collor | 1,666 | 16 | N/A |
| | Conservative | Pauline Margaret Beresford | 1,622 | 16 | -7 |
| | Liberal Democrats | Janet Anita Florence Hilton | 334 | 3 | -11 |
| | Liberal Democrats | Clive John Meredith | 313 | 3 | -11 |
| Majority | 345 | 3 | |
| Turnout | 10,333 | 27 | -5 |
| | Labour gain from Conservative | Swing | | |
| | Labour gain from Conservative | Swing | | |
Dover West | Party | Candidate | Votes | % | ±% |
| | Conservative | Geoff Lymer | 1,778 | 38 | -7 |
| | UKIP | John Gordon Killip | 1,653 | 36 | +11 |
| | Labour | Mick Smith | 855 | 18 | +6 |
| | Liberal Democrats | Peter Alexander Lodge | 237 | 5 | -13 |
| | | Vic Matcham | 114 | 2 | N/A |
| Majority | 125 | 2 | |
| Turnout | 4,637 | 35 | -7 |
| | Conservative hold | Swing | | |
Sandwich | Party | Candidate | Votes | % | ±% |
| | Conservative | Leyland Bradshaw Ridings, MBE | 2,093 | 45 | -12 |
| | UKIP | Mark Stubbings | 1,173 | 25 | N/A |
| | Labour | David Pestell | 983 | 21 | +7 |
| | Liberal Democrats | Russell James Timpson | 381 | 8 | -21 |
| Majority | 920 | 20 | |
| Turnout | 4,630 | 34 | -6 |
| | Conservative hold | Swing | | |
There is a single-member and two multi-member constituencies within the Borough of Gravesham, which elect a total of five councillors to Kent County Council. Below are the results:[9]
Gravesham East (2 Seats) | Party | Candidate | Votes | % | ±% |
| | Labour | Colin William Caller | 3,659 | 23 | +10 |
| | Labour | Jane Cribbon | 3,581 | 22 | +8 |
| | Conservative | John Martin Cubitt | 2,786 | 17 | -5 |
| | UKIP | David Shaun Beattie | 2,342 | 15 | N/A |
| | Conservative | Samir Jassal | 2,250 | 14 | -6 |
| | English Democrat | Jason Andrew Mee | 663 | 4 | -4 |
| | Liberal Democrats | Martin James Wilson | 380 | 2 | -4 |
| | TUSC | Chas Berry | 256 | 2 | N/A |
| Majority | 795 | 5 | |
| Turnout | 15,926 | 29 | -5 |
| | Labour hold | Swing | | |
| | Labour hold | Swing | | |
Gravesham Rural | Party | Candidate | Votes | % | ±% |
| | Conservative | Bryan John Sweetland | 3,213 | 63 | +3 |
| | Labour | Douglas Campbell Christie | 954 | 19 | +9 |
| | English Democrat | Steven Charles Clegg | 922 | 18 | +7 |
| Majority | 2259 | 44 | |
| Turnout | 5089 | 31 | -12 |
| | Conservative hold | Swing | | |
Northfleet and Gravesend West (2 Seats) | Party | Candidate | Votes | % | ±% |
| | Labour | Narinderjit Singh Thandi | 3,884 | 28 | +9 |
| | Labour | Sue Howes | 3,471 | 25 | +7 |
| | UKIP | Michael Glyn Dixon | 2,104 | 15 | N/A |
| | Conservative | Harold John Craske | 2,041 | 15 | -4 |
| | Conservative | Alan Michael Ridgers | 1,710 | 12 | -4 |
| | English Democrat | Stephen Francis-Weatherall | 748 | 5 | -2 |
| Majority | 1367 | 10 | |
| Turnout | 13,958 | 27 | -8 |
| | Labour gain from Conservative | Swing | | |
| | Labour hold | Swing | | |
Maidstone
There are seven single-member and one multi-member constituencies within the Borough of Maidstone, which elect a total of nine councillors to Kent County Council. Below are the results:[10]
Maidstone Central (2 Seats) | Party | Candidate | Votes | % | ±% |
| | Liberal Democrats | Dan Daley | 3,087 | 20 | -6 |
| | Liberal Democrats | Rob Bird | 2,730 | 18 | -4 |
| | UKIP | Simon Peter John Parry | 1,635 | 11 | +4 |
| | Conservative | Paul Francis Butcher | 1,604 | 11 | -3 |
| | Conservative | David Christopher Burton | 1,471 | 10 | -4 |
| | UKIP | James Samuel Rosier | 1,385 | 9 | N/A |
| | Labour | Paul Harper | 1,112 | 7 | +4 |
| | Labour | Marianna Romeojuliet Poliszczuk | 839 | 6 | +3 |
| | Green | Stuart Robert Jeffery | 645 | 4 | -2 |
| | Green | Wendy Kathleen Lewis | 486 | 3 | -1 |
| | English Democrat | Geoffrey Leonard Porter | 115 | 1 | N/A |
| Turnout | 15,109 | 28 | -4 |
| | Liberal Democrats hold | Swing | | |
| | Liberal Democrats hold | Swing | | |
Maidstone North East | Party | Candidate | Votes | % | ±% |
| | Liberal Democrats | Ian Stephen Chittenden | 1,542 | 42 | -11 |
| | UKIP | Charles Richard Elliott | 894 | 24 | +9 |
| | Conservative | Annabelle Jane Blackmore | 740 | 20 | -6 |
| | Labour | Keith Adkinson | 327 | 9 | N/A |
| | Green | Andrew Crawford Waldie | 180 | 5 | -1 |
| | English Democrat | Matthew James Godden | 25 | 1 | N/A |
| Majority | 648 | 18 | |
| Turnout | 3,708 | 29 | -7 |
| | Liberal Democrats hold | Swing | | |
Maidstone Rural East | Party | Candidate | Votes | % | ±% |
| | Conservative | Jenny Whittle | 2,780 | 69 | -5 |
| | Labour | Jim Grogan | 555 | 14 | +5 |
| | Green | Penny Kemp | 453 | 11 | N/A |
| | Liberal Democrats | Geoffrey Richard Samme | 213 | 5 | -12 |
| Majority | 2,225 | 55 | |
| Turnout | 4,001 | 30 | -12 |
| | Conservative hold | Swing | | |
Maidstone Rural North | Party | Candidate | Votes | % | ±% |
| | Conservative | Paul Carter | 1,915 | 46 | -12 |
| | UKIP | Terence Morris Turner | 1,291 | 31 | +16 |
| | Labour | Mick Beckwith | 473 | 11 | +4 |
| | Liberal Democrats | Brian Richard Edwin Mortimer | 298 | 7 | -4 |
| | Green | Ciaran Dominic Oliver | 217 | 5 | -2 |
| Majority | 624 | 13 | |
| Turnout | 4,194 | 29 | -9 |
| | Conservative hold | Swing | | |
Maidstone Rural South | Party | Candidate | Votes | % | ±% |
| | Conservative | Eric Hotson | 1,884 | 58 | -4 |
| | Green | Robin James Kinrade | 508 | 16 | +3 |
| | Liberal Democrats | Derek John Mortimer | 831 | 26 | +1 |
| Majority | 1,053 | 42 | |
| Turnout | 3,223 | 30 | -10 |
| | Conservative hold | Swing | | |
Maidstone Rural West | Party | Candidate | Votes | % | ±% |
| | Conservative | Paulina Annette Veronica Stockell | 1,886 | 43 | -3 |
| | UKIP | Keith Clement Woollven | 1,352 | 31 | +16 |
| | Labour | Edith Maud Davis | 445 | 10 | +5 |
| | Liberal Democrats | Martin Cox | 420 | 10 | -16 |
| | Green | Ian McDonald | 264 | 6 | -1 |
| Majority | 534 | 12 | |
| Turnout | 4,367 | 31 | -11 |
| | Conservative hold | Swing | | |
Maidstone South | Party | Candidate | Votes | % | ±% |
| | Liberal Democrats | Brian Eugene Clark | 1,790 | 47 | +18 |
| | Conservative | Christopher John Garland | 1,112 | 29 | -15 |
| | Labour | Geoff Harvey | 586 | 15 | +7 |
| | Green | Ashley James Wakeling | 303 | 8 | +1 |
| Majority | 678 | 18 | |
| Turnout | 3,791 | 28 | -7 |
| | Liberal Democrats gain from Conservative | Swing | | |
Maidstone South East | Party | Candidate | Votes | % | ±% |
| | Conservative | Gary Cooke | 1,056 | 44 | +1 |
| | Labour | Malcolm McKay | 773 | 32 | +17 |
| | Green | Steven Fraser Muggeridge | 284 | 12 | +7 |
| | Liberal Democrats | David Sandru Naghi | 272 | 11 | -3 |
| Majority | 283 | 12 | |
| Turnout | 2,385 | 20 | -8 |
| | Conservative hold | Swing | | |
Sevenoaks
There are seven single-member constituencies within the District of Sevenoaks which elect to Kent County Council. Below are the results:[11]
Darent Valley | Party | Candidate | Votes | % | ±% |
| | Conservative | Roger Gough | 1,677 | 49 | -1 |
| | UKIP | Alun Elder-Brown | 897 | 26 | N/A |
| | Labour | Kevin Roger Flack | 647 | 19 | +8 |
| | Liberal Democrats | Philip Neil Hobson | 166 | 5 | -15 |
| | English Democrat | Jim Read | 65 | 2 | -17 |
| Majority | 880 | 23 | |
| Turnout | 3,452 | 27 | -12 |
| | Conservative hold | Swing | | |
Sevenoaks Central | Party | Candidate | Votes | % | ±% |
| | Conservative | Margaret Eileen Crabtree | 2,171 | 56 | -3 |
| | UKIP | Marcus Von Thiele | 603 | 15 | N/A |
| | Liberal Democrats | Lise Shay Michaelides | 578 | 15 | -6 |
| | Labour | Nick Dineen | 389 | 10 | +4 |
| | Independent | Mark Calder Ellis | 112 | 3 | N/A |
| | English Democrat | Paul Cooper | 48 | 1 | -4 |
| Majority | 1,568 | 41 | |
| Turnout | 3,901 | 30 | -13 |
| | Conservative hold | Swing | | |
Sevenoaks East | Party | Candidate | Votes | % | ±% |
| | Conservative | Nick Chard | 1,715 | 51 | -1 |
| | UKIP | Christine Jennifer Marshall | 830 | 25 | N/A |
| | Liberal Democrats | Richard Charles Wassell | 455 | 13 | -11 |
| | Labour | Meg Warne | 332 | 10 | +6 |
| | English Democrat | Darren Tomlin | 45 | 1 | -10 |
| Majority | 885 | 26 | |
| Turnout | 3,377 | 27 | -14 |
| | Conservative hold | Swing | | |
Sevenoaks North East | Party | Candidate | Votes | % | ±% |
| | Conservative | David Brazier | 1,843 | 49 | -7 |
| | UKIP | Richard John Harrington | 1,160 | 31 | N/A |
| | Labour | Jim Weekes | 495 | 13 | +3 |
| | Green | Mark Richard Lindop | 226 | 6 | N/A |
| | English Democrat | Louise Uncles | 67 | 2 | -19 |
| Majority | 683 | 18 | |
| Turnout | 3,791 | 27 | -10 |
| | Conservative hold | Swing | | |
Sevenoaks South | Party | Candidate | Votes | % | ±% |
| | Conservative | Clive Roger Pearman | 1,575 | 46 | -6 |
| | UKIP | Lorraine Millgate | 898 | 26 | N/A |
| | Liberal Democrats | Richard Giles Streatfeild | 573 | 17 | -6 |
| | Labour | Thomas Dundas Geldard | 329 | 10 | N/A |
| | English Democrat | Chris Dunmall | 41 | 1 | -11 |
| Majority | 677 | 20 | |
| Turnout | 3,416 | 28 | -13 |
| | Conservative hold | Swing | | |
Sevenoaks West | Party | Candidate | Votes | % | ±% |
| | Conservative | Richard Parry | 1,687 | 51 | -4 |
| | UKIP | Andrew Osborne | 891 | 27 | N/A |
| | Labour | Gregory Stewart Lovell | 263 | 8 | +3 |
| | Liberal Democrats | Allan John Gidley Wright | 227 | 7 | -8 |
| | Green | Amelie Elisabeth Boleyn | 220 | 7 | N/A |
| | English Democrat | Andy Waghorn | 21 | 1 | -8 |
| Majority | 796 | 24 | |
| Turnout | 3,309 | 27 | -14 |
| | Conservative hold | Swing | | |
Swanley | Party | Candidate | Votes | % | ±% |
| | Conservative | Robert Brookbank | 1,032 | 41 | -2 |
| | Labour | Michael Hogg | 812 | 32 | +9 |
| | UKIP | Colin Attridge | 501 | 20 | N/A |
| | Green | Aleks Szram | 77 | 3 | N/A |
| | English Democrat | Steve Uncles | 60 | 2 | -21 |
| | BNP | Eric Elliott | 32 | 1 | N/A |
| Majority | 220 | 9 | |
| Turnout | 2,514 | 22 | -11 |
| | Conservative hold | Swing | | |
Shepway
There are six single-member constituencies within the District of Shepway, that elect councillors to Kent County Council. The results are:[12]
Elham Valley | Party | Candidate | Votes | % | ±% |
| | Conservative | Susan Joan Carey | 3,519 | 44 | -12 |
| | UKIP | Nick Jack | 1,861 | 34 | +14 |
| | Labour | Claire Jeffrey | 799 | 15 | +9 |
| | Liberal Democrats | Tom McNeice | 398 | 7 | -7 |
| Majority | 562 | 10 | |
| Turnout | 5,451 | 35 | -9 |
| | Conservative hold | Swing | | |
Folkestone North East | Party | Candidate | Votes | % | ±% |
| | UKIP | Frank McKenna | 910 | 29 | +12 |
| | Independent | Brian William Copping | 846 | 27 | +2 |
| | Conservative | Ann Elizabeth Berry | 664 | 21 | -6 |
| | Liberal Democrats | Lynne Beaumont | 404 | 13 | -9 |
| | Labour | Paul Richard Bingham | 324 | 10 | +3 |
| Majority | 64 | 2 | |
| Turnout | 3166 | 25% | -9 |
| | UKIP gain from Conservative | Swing | | |
Folkestone South | Party | Candidate | Votes | % | ±% |
| | UKIP | Bob Neaves | 1,006 | 33 | +10 |
| | Conservative | Rory Cassian Love | 989 | 33 | -10 |
| | Labour | Ben Hart | 639 | 21 | +11 |
| | Liberal Democrats | Gary Fuller | 353 | 12 | -12 |
| | BNP | Harry Williams | 41 | 1 | N/A |
| Majority | 17 | 0 | |
| Turnout | 3028 | 24 | -10 |
| | UKIP gain from Conservative | Swing | | |
Folkestone West | Party | Candidate | Votes | % | ±% |
| | UKIP | Hod Birkby | 1,155 | 33 | +10 |
| | Liberal Democrats | Tim Prater | 903 | 26 | +2 |
| | Conservative | Robert Bliss | 763 | 22 | +21 |
| | Labour | Peter Wallace | 354 | 10 | 0 |
| | Green | Derek John Moran | 238 | 7 | N/A |
| | TUSC | Seth Cruse | 86 | 2 | N/A |
| Majority | 252 | 7 | |
| Turnout | 3,514 | 29 | -5 |
| | UKIP gain from Liberal Democrats | Swing | | |
Hythe | Party | Candidate | Votes | % | ±% |
| | Green | Martin Edward Whybrow | 1,659 | 35 | N/A |
| | Conservative | David Drury Monk | 1,346 | 28 | -26 |
| | UKIP | Georgina Baker | 1,100 | 23 | +9 |
| | Labour | Paul Anthony Brownscombe | 418 | 9 | +4 |
| | Liberal Democrats | Neil Matthews | 248 | 5 | -18 |
| Majority | 313 | 7 | |
| Turnout | 4771 | 40 | -6 |
| | Green hold | Swing | | |
Romney Marsh | Party | Candidate | Votes | % | ±% |
| | UKIP | David Baker | 2,233 | 39 | +15 |
| | Conservative | Carole Joy Waters | 2,213 | 39 | -7 |
| | Labour | Arran Harvey | 725 | 13 | +6 |
| | Green | Ross Carter | 319 | 6 | N/A |
| | Liberal Democrats | Ted Last | 237 | 4 | -9 |
| Majority | 20 | 0 | |
| Turnout | 5743 | 32 | -7 |
| | UKIP hold | Swing | | |
There are six single-member constituencies and one multi-member constituencies within the Borough of Swale, which elect a total of eight councillors to Kent County Council. Below are the results:[13]
Faversham | Party | Candidate | Votes | % | ±% |
| | Conservative | Tom Gates | 1,958 | 45 | -2 |
| | Labour | Trevor Raymond Payne | 1337 | 31 | +18 |
| | UKIP | Benjamin Bruce Moss | 867 | 20 | +7 |
| | Liberal Democrats | David John Spurling | 169 | 4 | -12 |
| Majority | 621 | 14 | |
| Turnout | 4331 | 30 | -7 |
| | Conservative hold | Swing | | |
Sheerness | Party | Candidate | Votes | % | ±% |
| | Labour | Angela Harrison | 1,185 | 40 | +11 |
| | UKIP | Maureen Morgan | 1,036 | 35 | |
| | Conservative | Richard William Darby | 734 | 25 | -9 |
| Majority | 149 | 5 | |
| Turnout | 2,955 | 23 | -6 |
| | Labour gain from Conservative | Swing | | |
Sheppey | Party | Candidate | Votes | % | ±% |
| | UKIP | Adrian Derwent Crowther | 1,791 | 44 | |
| | Conservative | Ken Pugh | 1,066 | 26 | -15 |
| | Labour | Patrick John Wiggins | 900 | 22 | +7 |
| | Liberal Democrats | David Richard Kemp | 100 | 2 | -6 |
| | TUSC | Mike Rolfe | 97 | 2 | |
| | Monster Raving Loony | Young Mad Mike | 88 | 2 | -4 |
| Majority | 725 | 18 | |
| Turnout | 4,042 | 27 | -3 |
| | UKIP gain from Conservative | Swing | | |
Swale Central (2) | Party | Candidate | Votes | % | ±% |
| | Labour | Roger Truelove | 2,729 | 18 | +2 |
| | UKIP | Lee Burgess | 2,603 | 17 | |
| | UKIP | Derek Carnell | 2,415 | 16 | |
| | Labour | Ghlin Maurice Whelan | 2,389 | 15 | +2 |
| | Conservative | Mike Whiting | 2,334 | 15 | -9 |
| | Conservative | Alan Thomas Willicombe | 2,207 | 14 | -9 |
| | Liberal Democrats | Anthea Mary Spurling | 386 | 2 | -9 |
| | Liberal Democrats | Mary Zeng | 331 | 2 | -8 |
| | Monster Raving Loony | Sheikh Mihand | 127 | 1 | -2 |
| Majority | 188 | 1 | |
| Turnout | 15,521 | 29 | -4 |
| | Labour gain from Conservative | Swing | | |
| | UKIP gain from Conservative | Swing | | |
Swale East | Party | Candidate | Votes | % | ±% |
| | Conservative | Andrew Harry Thomas Bowles | 1,882 | 46 | -4 |
| | UKIP | Stephen Trafford | 1,109 | 27 | +12 |
| | Labour | Ashley Luke Wise | 825 | 20 | +9 |
| | Liberal Democrats | Dave Banks | 282 | 7 | -5 |
| Majority | 773 | 19 | |
| Turnout | 4,098 | 28 | -6 |
| | Conservative hold | Swing | | |
Swale West | Party | Candidate | Votes | % | ±% |
| | UKIP | Mike Baldock | 2,097 | 51 | |
| | Conservative | Keith Anthony Ferrin | 1,315 | 32 | -24 |
| | Labour | Leslie Peter Hallybone | 489 | 12 | -3 |
| | Liberal Democrats | Ann Scott Mclean | 181 | 4 | -25 |
| Majority | 783 | 19 | |
| Turnout | 4,081 | 30 | -5 |
| | UKIP gain from Conservative | Swing | | |
There are two single-member and three multi-member constituencies within the District of Thanet, which elect a total of eight councillors to Kent County Council. Below are the results:[14]
Birchington and Villages | Party | Candidate | Votes | % | ±% |
| | UKIP | Roger Anthony Latchford | 2,156 | 47 | N/A |
| | Conservative | Michael James Jarvis | 1,494 | 32 | -20 |
| | Labour | Amy Florence Rutland | 649 | 14 | +4 |
| | Liberal Democrats | Bill Furness | 315 | 7 | -12 |
| Majority | 662 | 15 | |
| Turnout | 4,614 | 34 | -6 |
| | UKIP gain from Conservative | Swing | | |
Broadstairs and Sir Moses Montefiore (2 Seats) | Party | Candidate | Votes | % | ±% |
| | UKIP | Alan Terry | 2,797 | 20 | N/A |
| | UKIP | Zita Wiltshire | 2,756 | 19 | N/A |
| | Conservative | Robert William Bayford | 2,182 | 15 | -13 |
| | Conservative | Bill Hayton | 2,094 | 15 | -11 |
| | Labour | Jenny Matterface | 1,854 | 13 | +3 |
| | Labour | Dick Symonds | 1,608 | 11 | 0 |
| | Green | Louisa June Rachel Latham | 427 | 3 | N/A |
| | Liberal Democrats | Louisa June Rachel Latham | 338 | 2 | -11 |
| | Liberal Democrats | Seth Procter | 265 | 2 | -9 |
| Majority | 574 | 4 | |
| Turnout | 14,321 | 33 | -3 |
| | UKIP gain from Conservative | Swing | | |
| | UKIP gain from Conservative | Swing | | |
Margate and Cliftonville (2 Seats) | Party | Candidate | Votes | % | ±% |
| | UKIP | Mo Elenor | 2,070 | 18 | +3 |
| | Labour | William Scobie | 2,059 | 18 | 0 |
| | Labour | Louise Drelaud | 2,000 | 17 | -1 |
| | UKIP | Clinton Sear | 1,811 | 16 | N/A |
| | Conservative | Ian James Gregory | 1,428 | 12 | -8 |
| | Conservative | Chris Wells | 1,354 | 12 | -9 |
| | Green | Edward Targett | 276 | 2 | N/A |
| | Liberal Democrats | Matt Brown | 247 | 2 | -3 |
| | Liberal Democrats | Tony Flaig | 222 | 2 | -1 |
| Majority | 59 | 1 | |
| Turnout | 11,467 | 27 | -4 |
| | UKIP gain from Conservative | Swing | | |
| | Labour gain from Conservative | Swing | | |
Margate West | Party | Candidate | Votes | % | ±% |
| | UKIP | Jeffrey Elenor | 1,292 | 36 | +14 |
| | Conservative | Robert Barry Burgess | 915 | 26 | -19 |
| | Labour | John Edwards | 728 | 20 | +6 |
| | Independent | Thomas George King | 550 | 15 | N/A |
| | Liberal Democrats | Michael Steed | 77 | 2 | -11 |
| Majority | 377 | 10 | |
| Turnout | 3,562 | 29 | -2 |
| | UKIP gain from Conservative | Swing | | |
Ramsgate (2 Seats) | Party | Candidate | Votes | % | ±% |
| | UKIP | Trevor Shonk | 3,347 | 22 | +8 |
| | UKIP | Martyn Heale | 3,044 | 20 | N/A |
| | Labour | Elizabeth Green | 2,478 | 16 | 0 |
| | Labour | Rick Everitt | 2,258 | 15 | +2 |
| | Conservative | John Derek Kirby | 1,583 | 10 | -9 |
| | Conservative | Jo Gideon | 1,458 | 9 | -6 |
| | Independent | Ian Driver | 567 | 4 | N/A |
| | Green | Mike White | 471 | 3 | N/A |
| | Liberal Democrats | Anne Elizabeth Jones | 211 | 1 | -5 |
| Majority | 566 | 4 | |
| Turnout | 15,417 | 31 | -4 |
| | UKIP gain from Conservative | Swing | | |
| | UKIP gain from Labour | Swing | | |
There are five single-member constituencies and one multi-member constituency within the District of Tonbridge and Malling, which elect a total of seven councillors to Kent County Council. Below are the results:[15]
Malling Central | Party | Candidate | Votes | % | ±% |
| | Liberal Democrats | Trudy Dean | 2,209 | 55 | -1 |
| | Conservative | Russ Taylor | 793 | 20 | -5 |
| | UKIP | Peter Graham Stevens | 658 | 16 | +6 |
| | Labour | Sarah Rosalind Palmer | 283 | 7 | +3 |
| | Green | Stephen Greville Jackson | 56 | 1 | -2 |
| | English Democrat | Anna Cleves | 20 | 0 | -2 |
| Majority | 1416 | 35 | |
| Turnout | 4,019 | 34 | -4 |
| | Liberal Democrats hold | Swing | | |
Malling North | Party | Candidate | Votes | % | ±% |
| | Conservative | Sarah Virginia Hohler | 1,869 | 46 | -3 |
| | Labour | Paul Michael Hickmott | 1,112 | 27 | +5 |
| | UKIP | Philip John Granger | 803 | 20 | N/A |
| | Liberal Democrats | Liz Simpson | 158 | 4 | -7 |
| | Green | Mark West | 118 | 3 | -5 |
| | English Democrat | Lee Jon | 31 | 1 | -8 |
| Majority | 757 | 19 | |
| Turnout | 4,091 | 31 | -6 |
| | Conservative hold | Swing | | |
Malling Rural East | Party | Candidate | Votes | % | ±% |
| | Conservative | Matthew Aiden Craig Balfour | 1,781 | 48 | -10 |
| | UKIP | David Leonard Waller | 1,185 | 32 | +19 |
| | Labour | Terry Scott | 350 | 9 | +3 |
| | Liberal Democrats | Stephen James Patt | 201 | 5 | -7 |
| | Green | Frances Mary Long | 158 | 4 | -4 |
| | English Democrat | Liz Uncles | 26 | 1 | -3 |
| Majority | 596 | 16 | |
| Turnout | 3,701 | 30 | -8 |
| | Conservative hold | Swing | | |
Malling Rural North East | Party | Candidate | Votes | % | ±% |
| | Conservative | Peter John Homewood | 1,856 | 46 | -11 |
| | UKIP | Angela Love | 1,098 | 27 | N/A |
| | Labour | James Aiden Yearsley | 635 | 16 | +9 |
| | Liberal Democrats | Anita Sandra Oakley | 315 | 8 | -14 |
| | Green | Howard Porter | 123 | 3 | +3 |
| | English Democrat | Steve Uncles | 42 | 1 | -7 |
| Majority | 758 | 19 | |
| Turnout | 4,069 | 29 | -12 |
| | Conservative hold | Swing | | |
Malling West | Party | Candidate | Votes | % | ±% |
| | Conservative | Valerie Dagger | 1,949 | 55 | -7 |
| | UKIP | Clifford John Leslie Millgate | 844 | 24 | N/A |
| | Labour | Kathleen Maria Garlick | 319 | 9 | +3 |
| | Green | Richard Paul Mountford | 194 | 5 | -4 |
| | Liberal Democrats | Jason Lower | 186 | 5 | -9 |
| | English Democrat | Helen Stevens | 37 | 1 | -8 |
| Majority | 1,105 | 31 | |
| Turnout | 3,529 | 30 | -13 |
| | Conservative hold | Swing | | |
Tonbridge (2 Seats) | Party | Candidate | Votes | % | ±% |
| | Conservative | Richard Long, TD | 3,406 | 24 | -2 |
| | Conservative | Chris Smith | 3,123 | 22 | -1 |
| | UKIP | Roy Alfred Philpott | 1,664 | 12 | +5 |
| | UKIP | Adrian John Stevens | 1,443 | 10 | +4 |
| | Labour | Claire Suzanne Leigh | 1,104 | 8 | +3 |
| | Labour | Bob Ellard | 1,012 | 7 | +3 |
| | Green | Hazel Dawe | 633 | 5 | -1 |
| | Liberal Democrats | Garry Christopher Bridge | 573 | 4 | -4 |
| | Liberal Democrats | Nicholas Sebastian Scott Ford | 526 | 4 | -5 |
| | Green | Steven Mark Dawe | 515 | 4 | -1 |
| Majority | 1,459 | 10 | |
| Turnout | 13,999 | 28 | -11 |
| | Conservative hold | Swing | | |
| | Conservative hold | Swing | | |
Tunbridge Wells
There are six single-member constituencies within the Borough of Tunbridge Wells. Below are the results:[16]
Cranbrook (includes Hawkhurst) | Party | Candidate | Votes | % | ±% |
| | Conservative | Sean Holden | 1,553 | 41 | -25 |
| | UKIP | John Cave Austen | 1,065 | 28 | N/A |
| | Liberal Democrats | Francis John Rook | 686 | 18 | -9 |
| | Labour | David Burgess | 293 | 8 | +2 |
| | Green | Marie Louise Jones | 202 | 5 | N/A |
| Majority | 498 | 13 | |
| Turnout | 3,799 | 33 | -8 |
| | Conservative hold | Swing | | |
Tunbridge Wells East | Party | Candidate | Votes | % | ±% |
| | UKIP | Christopher Pierce David Hoare | 1,386 | 31 | +19 |
| | Conservative | James Tansley | 1,064 | 23 | -26 |
| | Liberal Democrats | David John Neve | 1,005 | 22 | -10 |
| | Independent | Terry Cload | 694 | 15 | N/A |
| | Labour | Gerry Colley | 379 | 8 | +1 |
| Majority | 322 | 8 | |
| Turnout | 4,528 | 34 | -4 |
| | UKIP gain from Conservative | Swing | | |
Tunbridge Wells North | Party | Candidate | Votes | % | ±% |
| | Conservative | Peter John Oakford | 1,373 | 35 | -3 |
| | UKIP | Brian Charles Ransley | 958 | 24 | +10 |
| | Labour | Ian Patrick Carvell | 672 | 17 | +4 |
| | Liberal Democrats | Trevor William Poile | 666 | 17 | -18 |
| | Green | Phyllis Valerie Leslie | 262 | 7 | N/A |
| Majority | 415 | 11 | |
| Turnout | 3,931 | 29 | -8 |
| | Conservative hold | Swing | | |
Tunbridge Wells Rural | Party | Candidate | Votes | % | ±% |
| | Conservative | Alex King, MBE | 2,043 | 43 | -21 |
| | UKIP | Gabi Coleman | 1,692 | 36 | N/A |
| | Labour | Raymond Peter Moon | 632 | 13 | +3 |
| | Liberal Democrats | Lesley Elizabeth Herriot | 368 | 8 | -18 |
| Majority | 351 | 7 | |
| Turnout | 4,735 | 31 | -6 |
| | Conservative hold | Swing | | |
Tunbridge Wells South | Party | Candidate | Votes | % | ±% |
| | Conservative | James Edward Scholes | 1,926 | 46 | -16 |
| | UKIP | Zak Martin | 1,109 | 26 | N/A |
| | Labour | Lorna Blackmore | 616 | 15 | +7 |
| | Liberal Democrats | Rachel Cerys Sadler | 534 | 13 | -17 |
| Majority | 817 | 20 | |
| Turnout | 4,185 | 30 | -9 |
| | Conservative hold | Swing | | |
Tunbridge Wells West | Party | Candidate | Votes | % | ±% |
| | Conservative | John Davies | 1,831 | 41 | -11 |
| | UKIP | Victor Charles Webb | 1,502 | 33 | +21 |
| | Labour | Alex Britcher | 496 | 11 | +5 |
| | Liberal Democrats | Alan James Bullion | 357 | 8 | -9 |
| | Green | David Charles Holton | 316 | 7 | -5 |
| Majority | 329 | 8 | |
| Turnout | 4,502 | 32 | -2 |
| | Conservative hold | Swing | | |
References
- ^ "County Council Elections". Kent County Council. 1 April 2013. Retrieved 1 April 2013.
- ^ "The Representation of the People (Form of Canvass) (England and Wales) Regulations 2006, Schedule Part 1". Legislation.gov.uk. 13 October 2011. Retrieved 18 April 2012.
- ^ "I have two homes. Can I register at both addresses?". The Electoral Commission. Archived from the original on 31 December 2013. Retrieved 5 January 2011.
- ^ "UKIP name Kent opposition leader". BBC. 7 May 2013.
- ^ https://shareweb.kent.gov.uk/Documents/council-and-democracy/elections/persons%20nominated/nominations-ashford.pdf[permanent dead link]
- ^ https://shareweb.kent.gov.uk/Documents/council-and-democracy/elections/persons%20nominated/nomination-canterbury.pdf[permanent dead link]
- ^ https://shareweb.kent.gov.uk/Documents/council-and-democracy/elections/persons%20nominated/nominations-dartford.pdf[permanent dead link]
- ^ https://shareweb.kent.gov.uk/Documents/council-and-democracy/elections/persons%20nominated/nominations-dover.pdf[permanent dead link]
- ^ https://shareweb.kent.gov.uk/Documents/council-and-democracy/elections/persons%20nominated/nomination-gravesham.pdf[permanent dead link]
- ^ https://shareweb.kent.gov.uk/Documents/council-and-democracy/elections/persons%20nominated/nominations-maidstone.pdf[permanent dead link]
- ^ https://shareweb.kent.gov.uk/Documents/council-and-democracy/elections/persons%20nominated/nominations-sevenoaks.pdf[permanent dead link]
- ^ https://shareweb.kent.gov.uk/Documents/council-and-democracy/elections/persons%20nominated/nominations-shepway.pdf[permanent dead link]
- ^ https://shareweb.kent.gov.uk/Documents/council-and-democracy/elections/persons%20nominated/nominations-swale.pdf[permanent dead link]
- ^ https://shareweb.kent.gov.uk/Documents/council-and-democracy/elections/persons%20nominated/nominations-thanet.pdf[permanent dead link]
- ^ https://shareweb.kent.gov.uk/Documents/council-and-democracy/elections/persons%20nominated/nominations-ton-mallling.pdf[permanent dead link]
- ^ https://shareweb.kent.gov.uk/Documents/council-and-democracy/elections/persons%20nominated/nominations-twells.pdf[permanent dead link]
External links


 Council elections in Kent


