1860 United States presidential election in Virginia
Election in Virginia
 | |||||||||||||||||||||||||||||||||
| |||||||||||||||||||||||||||||||||
 County Results
| |||||||||||||||||||||||||||||||||
| |||||||||||||||||||||||||||||||||


The 1860 United States presidential election in Virginia took place on November 6, 1860, as part of the 1860 United States presidential election. Voters chose 15 representatives, or electors to the Electoral College, who voted for president and vice president.
Campaign
Archibald Campbell and John Curtiss Underwood attempted to have the Republican National Convention held in Wheeling, Virginia. Many national Republicans supported the idea, including chair Edwin D. Morgan. However, the hostile reaction to the Republican Party by the south after John Brown's raid on Harpers Ferry resulted in the committee choosing to host the convention in Chicago.[1]
1,500 people attended the Republican Party of Virginia's state convention in Wheeling on May 2, 1860. The party's delegation to the national convention was the sixth-largest there, despite a credentials challenge against the entire south by opponents of William H. Seward. The initially pro-Seward Virginia delegation gave a majority of its votes to Abraham Lincoln on the first ballot. The delegation supported Cassius Marcellus Clay for the vice presidential nomination.[2]
Four companies of Wide Awakes totaling 350 men were formed during the campaign.[3] Almost all of Lincoln's support came from around Wheeling[4] and his best county was Ohio County.[3]
Results
| 1860 United States presidential election in Virginia[5] | |||||
|---|---|---|---|---|---|
| Party | Candidate | Votes | Percentage | Electoral votes | |
| Constitutional Union | John Bell | 74,481 | 44.63% | 15 | |
| Southern Democratic | John C. Breckinridge | 74,325 | 44.54% | 0 | |
| Democratic | Stephen A. Douglas | 16,198 | 9.71% | 0 | |
| Republican | Abraham Lincoln | 1,887 | 1.13% | 0 | |
| Totals | 166,891 | 100.0% | 15 | ||
Results by County
| County | John Bell Constitutional Union | John C. Breckinridge Southern Democratic | Stephen A. Douglas Democratic | Abraham Lincoln Republican | Total Votes Cast[6] | ||||
|---|---|---|---|---|---|---|---|---|---|
| # | % | # | % | # | % | # | % | ||
| Accomack | 736 | 47.39% | 737 | 47.46% | 80 | 5.15% | 0 | 0.00% | 1,553 |
| Albemarle | 1,317 | 53.32% | 1,056 | 42.75% | 97 | 3.93% | 0 | 0.00% | 2,470 |
| Alexandria | 1,012 | 58.36% | 565 | 32.58% | 141 | 8.13% | 16 | 0.92% | 1,734 |
| Alleghany | 250 | 39.62% | 344 | 54.52% | 37 | 5.86% | 0 | 0.00% | 631 |
| Amelia | 282 | 50.09% | 249 | 44.23% | 32 | 5.68% | 0 | 0.00% | 563 |
| Amherst | 622 | 42.72% | 808 | 55.49% | 26 | 1.79% | 0 | 0.00% | 1,456 |
| Appomattox | 221 | 27.83% | 563 | 70.91% | 10 | 1.26% | 0 | 0.00% | 794 |
| Augusta | 2,553 | 66.05% | 218 | 5.64% | 1,094 | 28.31% | 0 | 0.00% | 3,865 |
| Barbour | 422 | 30.71% | 910 | 66.23% | 39 | 2.84% | 3 | 0.22% | 1,374 |
| Bath | 220 | 45.32% | 163 | 40.25% | 22 | 5.43% | 0 | 0.00% | 405 |
| Bedford | 1,468 | 56.55% | 1,037 | 39.95% | 91 | 3.50% | 0 | 0.00% | 2,596 |
| Berkeley | 913 | 49.38% | 830 | 44.89% | 106 | 5.73% | 0 | 0.00% | 1,849 |
| Boone | 121 | 34.67% | 204 | 58.45% | 24 | 6.88% | 0 | 0.00% | 349 |
| Botetourt | 590 | 43.61% | 589 | 43.53% | 174 | 12.86% | 0 | 0.00% | 1,353 |
| Braxton | 274 | 50.09% | 227 | 41.50% | 46 | 8.41% | 0 | 0.00% | 547 |
| Brooke | 173 | 19.84% | 450 | 51.61% | 76 | 8.72% | 173 | 19.84% | 872 |
| Brunswick | 308 | 32.90% | 444 | 46.28% | 187 | 19.91% | 0 | 0.00% | 939 |
| Buchanan | 14 | 8.38% | 134 | 80.24% | 19 | 11.38% | 0 | 0.00% | 167 |
| Buckingham | 545 | 50.00% | 523 | 47.98% | 22 | 2.02% | 0 | 0.00% | 1,090 |
| Cabell | 316 | 35.59% | 161 | 18.13% | 407 | 45.83% | 4 | 0.45% | 888 |
| Calhoun | 19 | 6.23% | 285 | 93.44% | 1 | 0.32% | 0 | 0.00% | 305 |
| Campbell | 1,521 | 52.90% | 1,208 | 42.02% | 146 | 5.08% | 0 | 0.00% | 2,875 |
| Caroline | 561 | 41.52% | 772 | 57.14% | 18 | 1.33% | 0 | 0.00% | 1,351 |
| Carroll | 315 | 29.86% | 729 | 69.10% | 11 | 1.04% | 0 | 0.00% | 1,055 |
| Charles City | 224 | 65.12% | 111 | 32.26% | 9 | 2.62% | 0 | 0.00% | 344 |
| Charlotte | 418 | 46.04% | 465 | 51.21% | 25 | 2.75% | 0 | 0.00% | 908 |
| Chesterfield | 788 | 46.24% | 328 | 19.25% | 588 | 34.51% | 0 | 0.00% | 1,704 |
| Clarke | 288 | 42.86% | 335 | 49.85% | 49 | 7.29% | 0 | 0.00% | 672 |
| Clay | 119 | 76.28% | 37 | 23.72% | 0 | 0.00% | 0 | 0.00% | 156 |
| Craig | 112 | 25.69% | 322 | 73.85% | 2 | 0.46% | 0 | 0.00% | 436 |
| Culpeper | 526 | 49.16% | 525 | 49.07% | 19 | 1.78% | 0 | 0.00% | 1,070 |
| Cumberland | 278 | 47.04% | 276 | 46.70% | 37 | 6.26% | 0 | 0.00% | 591 |
| Dinwiddie | 389 | 47.09% | 254 | 30.75% | 183 | 22.16% | 0 | 0.00% | 826 |
| Doddridge | 143 | 24.20% | 356 | 60.24% | 91 | 15.40% | 1 | 0.16% | 591 |
| Elizabeth City | 248 | 56.88% | 164 | 37.61% | 24 | 5.51% | 0 | 0.00% | 436 |
| Essex | 279 | 47.21% | 308 | 52.11% | 4 | 0.68% | 0 | 0.00% | 591 |
| Fairfax | 691 | 47.10% | 685 | 46.69% | 91 | 6.20% | 0 | 0.00% | 1,491 |
| Fauquier | 989 | 48.13% | 1,027 | 49.98% | 39 | 1.90% | 0 | 0.00% | 2,056 |
| Fayette | 381 | 55.46% | 241 | 35.08% | 65 | 9.46% | 0 | 0.00% | 687 |
| Floyd | 384 | 46.83% | 400 | 48.78% | 36 | 4.39% | 0 | 0.00% | 820 |
| Fluvanna | 487 | 51.97% | 443 | 47.28% | 7 | 0.72% | 0 | 0.00% | 937 |
| Franklin | 863 | 41.65% | 1,076 | 51.93% | 133 | 6.42% | 0 | 0.00% | 2,072 |
| Frederick | 963 | 41.08% | 1,315 | 56.10% | 66 | 2.82% | 0 | 0.00% | 2,344 |
| Giles | 366 | 54.46% | 244 | 36.31% | 62 | 9.23% | 0 | 0.00% | 672 |
| Gilmer | 117 | 28.40% | 268 | 65.05% | 27 | 6.55% | 0 | 0.00% | 412 |
| Gloucester | 301 | 39.55% | 460 | 60.45% | 0 | 0.00% | 0 | 0.00% | 761 |
| Goochland | 244 | 34.41% | 428 | 60.37% | 37 | 5.22% | 0 | 0.00% | 709 |
| Grayson | 315 | 40.49% | 447 | 57.46% | 16 | 2.05% | 0 | 0.00% | 762 |
| Greenbrier | 993 | 60.88% | 505 | 30.96% | 133 | 8.15% | 0 | 0.00% | 1,631 |
| Greene | 74 | 12.23% | 521 | 86.12% | 10 | 1.65% | 0 | 0.00% | 605 |
| Greensville | 139 | 41.99% | 151 | 45.62% | 41 | 12.39% | 0 | 0.00% | 331 |
| Halifax | 563 | 27.97% | 1,312 | 65.18% | 138 | 6.86% | 0 | 0.00% | 2,013 |
| Hampshire | 878 | 43.37% | 1,054 | 52.49% | 75 | 3.74% | 1 | 0.04% | 2,008 |
| Hancock | 33 | 5.29% | 262 | 41.32% | 85 | 13.42% | 254 | 40.06% | 634 |
| Hanover | 575 | 42.56% | 749 | 55.44% | 27 | 2.00% | 0 | 0.00% | 1,351 |
| Hardy | 894 | 67.57% | 355 | 26.83% | 74 | 5.60% | 0 | 0.00% | 1,323 |
| Harrison | 931 | 41.36% | 1,191 | 52.91% | 107 | 4.75% | 22 | 0.98% | 2,251 |
| Henrico | 1,403 | 62.83% | 641 | 28.71% | 189 | 8.46% | 0 | 0.00% | 2,233 |
| Henry | 543 | 51.91% | 444 | 44.45% | 59 | 5.64% | 0 | 0.00% | 1,046 |
| Highland | 215 | 33.59% | 170 | 26.56% | 255 | 39.84% | 0 | 0.00% | 640 |
| Isle of Wight | 147 | 15.93% | 757 | 82.02% | 19 | 2.05% | 0 | 0.00% | 923 |
| Jackson | 388 | 39.88% | 500 | 51.39% | 64 | 6.58% | 21 | 2.16% | 973 |
| James City | 148 | 69.48% | 60 | 28.17% | 5 | 2.35% | 0 | 0.00% | 213 |
| Jefferson | 959 | 51.64% | 458 | 24.66% | 440 | 23.69% | 0 | 0.00% | 1,857 |
| Kanawha | 1,176 | 67.55% | 513 | 29.47% | 52 | 2.99% | 0 | 0.00% | 1,741 |
| King and Queen | 255 | 33.25% | 510 | 66.49% | 2 | 0.26% | 0 | 0.00% | 767 |
| King George | 184 | 41.44% | 223 | 50.23% | 37 | 8.33% | 0 | 0.00% | 444 |
| King William | 142 | 30.54% | 315 | 67.74% | 8 | 1.72% | 0 | 0.00% | 465 |
| Lancaster | 209 | 57.58% | 142 | 39.12% | 12 | 3.31% | 0 | 0.00% | 363 |
| Lee | 462 | 33.82% | 894 | 65.45% | 10 | 0.73% | 0 | 0.00% | 1,366 |
| Lewis | 332 | 28.06% | 604 | 51.06% | 247 | 20.88% | 0 | 0.00% | 1,183 |
| Logan | 100 | 26.53% | 271 | 71.88% | 6 | 1.59% | 0 | 0.00% | 377 |
| Loudoun | 2,033 | 69.10% | 778 | 26.44% | 120 | 4.08% | 11 | 0.37% | 2,942 |
| Louisa | 498 | 39.71% | 754 | 60.13% | 2 | 0.16% | 0 | 0.00% | 1,254 |
| Lunenburg | 251 | 30.99% | 527 | 65.06% | 32 | 3.95% | 0 | 0.00% | 810 |
| McDowell | 35 | 48.61% | 37 | 51.39% | 0 | 0.00% | 0 | 0.00% | 72 |
| Madison | 74 | 7.97% | 834 | 89.87% | 20 | 2.16% | 0 | 0.00% | 928 |
| Marion | 569 | 27.84% | 1,337 | 65.41% | 137 | 6.70% | 1 | 0.01% | 2,044 |
| Marshall | 928 | 45.49% | 809 | 39.66% | 108 | 5.29% | 195 | 9.56% | 2,040 |
| Mason | 716 | 47.39% | 439 | 29.05% | 297 | 19.66% | 59 | 3.90% | 1,511 |
| Mathews | 251 | 45.06% | 306 | 54.94% | 0 | 0.00% | 0 | 0.00% | 557 |
| Mecklenburg | 430 | 30.85% | 901 | 64.63% | 63 | 4.52% | 0 | 0.00% | 1,394 |
| Mercer | 443 | 49.89% | 432 | 48.65% | 13 | 1.46% | 0 | 0.00% | 888 |
| Middlesex | 151 | 38.52% | 241 | 61.48% | 0 | 0.00% | 0 | 0.00% | 392 |
| Monongalia | 622 | 30.24% | 601 | 29.22% | 757 | 36.80% | 77 | 3.74% | 2,057 |
| Monroe | 693 | 53.47% | 520 | 40.12% | 83 | 6.40% | 0 | 0.00% | 1,296 |
| Montgomery | 712 | 58.79% | 425 | 35.09% | 74 | 6.11% | 0 | 0.00% | 1,211 |
| Morgan | 308 | 52.92% | 254 | 43.62% | 20 | 3.44% | 0 | 0.00% | 582 |
| Nansemond | 477 | 52.59% | 429 | 47.30% | 1 | 0.11% | 0 | 0.00% | 907 |
| Nelson | 733 | 59.35% | 390 | 31.58% | 112 | 9.07% | 0 | 0.00% | 1,235 |
| New Kent | 264 | 60.27% | 172 | 39.27% | 2 | 0.46% | 0 | 0.00% | 438 |
| Nicholas | 345 | 63.03% | 152 | 27.89% | 48 | 8.81% | 0 | 0.00% | 545 |
| Norfolk City | 982 | 59.38% | 439 | 26.54% | 233 | 14.09% | 0 | 0.00% | 1,654 |
| Norfolk County | 704 | 58.52% | 447 | 37.16% | 52 | 4.32% | 0 | 0.00% | 1,203 |
| Northampton | 234 | 51.54% | 214 | 47.14% | 6 | 1.32% | 0 | 0.00% | 454 |
| Northumberland | 276 | 44.02% | 350 | 55.82% | 1 | 0.16% | 0 | 0.00% | 627 |
| Nottoway | 232 | 52.85% | 179 | 40.77% | 28 | 6.39% | 0 | 0.00% | 439 |
| Ohio | 1,202 | 33.43% | 915 | 25.39% | 716 | 19.87% | 771 | 21.39% | 3,604 |
| Orange | 427 | 46.72% | 475 | 51.97% | 12 | 1.31% | 0 | 0.00% | 914 |
| Page | 141 | 12.23% | 937 | 81.27% | 75 | 6.50% | 0 | 0.00% | 1,153 |
| Patrick | 433 | 46.31% | 432 | 46.20% | 70 | 7.49% | 0 | 0.00% | 935 |
| Pendleton | 400 | 53.33% | 217 | 28.93% | 133 | 17.73% | 0 | 0.00% | 750 |
| Petersburg | 970 | 53.71% | 223 | 12.35% | 613 | 33.94% | 0 | 0.00% | 1,806 |
| Pittsylvania | 1,702 | 57.98% | 1,057 | 36.00% | 177 | 6.01% | 0 | 0.00% | 2,936 |
| Pleasants | 140 | 32.94% | 166 | 39.06% | 119 | 28.00% | 0 | 0.00% | 425 |
| Pocahontas | 163 | 30.99% | 333 | 63.31% | 30 | 5.70% | 0 | 0.00% | 526 |
| Portsmouth | 678 | 46.60% | 559 | 38.42% | 214 | 14.72% | 4 | 0.27% | 1,455 |
| Powhatan | 225 | 47.67% | 127 | 26.91% | 120 | 25.42% | 0 | 0.00% | 472 |
| Preston | 562 | 30.33% | 942 | 50.84% | 239 | 12.90% | 110 | 5.94% | 1,853 |
| Prince Edward | 374 | 43.39% | 423 | 49.07% | 65 | 7.54% | 0 | 0.00% | 862 |
| Prince George | 243 | 43.39% | 191 | 34.11% | 126 | 22.50% | 0 | 0.00% | 560 |
| Princess Anne | 451 | 53.31% | 379 | 44.80% | 16 | 1.89% | 0 | 0.00% | 846 |
| Prince William | 243 | 23.32% | 718 | 68.91% | 26 | 2.50% | 55 | 5.28% | 1,042 |
| Pulaski | 332 | 56.56% | 250 | 42.59% | 5 | 0.85% | 0 | 0.00% | 587 |
| Putnam | 400 | 52.29% | 327 | 42.75% | 38 | 4.97% | 0 | 0.00% | 765 |
| Raleigh | 230 | 73.48% | 69 | 22.04% | 14 | 4.47% | 0 | 0.00% | 313 |
| Randolph | 259 | 39.85% | 248 | 38.15% | 143 | 22.00% | 0 | 0.00% | 650 |
| Rappahannock | 491 | 52.85% | 409 | 44.03% | 29 | 3.12% | 0 | 0.00% | 929 |
| Richmond City | 2,402 | 55.58% | 1,167 | 27.08% | 753 | 17.42% | 0 | 0.00% | 4,322 |
| Richmond County | 353 | 64.89% | 185 | 34.01% | 6 | 1.10% | 0 | 0.00% | 544 |
| Ritchie | 224 | 26.26% | 544 | 63.77% | 73 | 8.56% | 12 | 1.41% | 853 |
| Roane | 237 | 45.84% | 264 | 51.06% | 16 | 3.09% | 0 | 0.00% | 517 |
| Roanoke | 293 | 40.81% | 373 | 51.95% | 52 | 7.24% | 0 | 0.00% | 718 |
| Rockbridge | 1,231 | 55.13% | 361 | 16.17% | 641 | 28.71% | 0 | 0.00% | 2,233 |
| Rockingham | 883 | 30.31% | 676 | 23.21% | 1,354 | 46.48% | 0 | 0.00% | 2,913 |
| Russell | 473 | 47.35% | 526 | 52.65% | 0 | 0.00% | 0 | 0.00% | 999 |
| Scott | 491 | 41.75% | 594 | 50.60% | 91 | 7.74% | 0 | 0.00% | 1,176 |
| Shenandoah | 427 | 17.13% | 1,883 | 75.53% | 170 | 6.82% | 13 | 0.52% | 2,493 |
| Smyth | 446 | 45.01% | 496 | 50.05% | 49 | 4.94% | 0 | 0.00% | 991 |
| Southampton | 545 | 48.79% | 563 | 50.40% | 9 | 0.81% | 0 | 0.00% | 1,117 |
| Spotsylvania | 599 | 43.66% | 516 | 37.61% | 257 | 18.73% | 0 | 0.00% | 1,372 |
| Stafford | 404 | 41.61% | 402 | 41.41% | 165 | 16.99% | 0 | 0.00% | 971 |
| Surry | 197 | 53.68% | 115 | 31.34% | 55 | 14.99% | 0 | 0.00% | 367 |
| Sussex | 177 | 31.22% | 294 | 51.85% | 96 | 16.93% | 0 | 0.00% | 567 |
| Taylor | 647 | 51.68% | 575 | 45.93% | 26 | 2.08% | 4 | 0.32% | 1,252 |
| Tazewell | 306 | 24.68% | 934 | 75.32% | 0 | 0.00% | 0 | 0.00% | 1,240 |
| Tucker | 22 | 15.28% | 99 | 68.75% | 23 | 15.97% | 0 | 0.00% | 144 |
| Tyler | 315 | 33.69% | 423 | 45.24% | 197 | 21.07% | 0 | 0.00% | 935 |
| Upshur | 331 | 33.98% | 589 | 60.47% | 54 | 5.54% | 0 | 0.00% | 974 |
| Warren | 276 | 36.80% | 462 | 61.60% | 12 | 1.60% | 0 | 0.00% | 750 |
| Warwick | 72 | 69.23% | 32 | 30.77% | 0 | 0.00% | 0 | 0.00% | 104 |
| Washington | 916 | 42.60% | 1,178 | 54.79% | 56 | 2.60% | 0 | 0.00% | 2,150 |
| Wayne | 326 | 56.82% | 166 | 28.42% | 82 | 14.04% | 10 | 1.71% | 584 |
| Webster | 86 | 45.03% | 96 | 50.26% | 9 | 4.71% | 0 | 0.00% | 191 |
| Westmoreland | 438 | 72.76% | 160 | 26.58% | 4 | 0.66% | 0 | 0.00% | 602 |
| Wetzel | 90 | 10.51% | 607 | 70.91% | 153 | 17.87% | 6 | 0.70% | 856 |
| Williamsburg | 49 | 42.24% | 43 | 37.07% | 24 | 20.69% | 0 | 0.00% | 116 |
| Wirt | 150 | 35.63% | 255 | 60.57% | 16 | 3.80% | 0 | 0.00% | 421 |
| Wise | 102 | 21.56% | 363 | 76.74% | 8 | 1.69% | 0 | 0.00% | 473 |
| Wood | 832 | 46.20% | 832 | 46.20% | 56 | 3.11% | 81 | 4.50% | 1,801 |
| Wyoming[a] | 60 | 61.22% | 29 | 29.60% | 9 | 9.18% | 0 | 0.00% | 98 |
| Wythe | 617 | 43.03% | 795 | 55.44% | 22 | 1.53% | 0 | 0.00% | 1,434 |
| York | 227 | 70.93% | 90 | 28.13% | 3 | 0.94% | 0 | 0.00% | 320 |
| Total | 74,701 | 44.65% | 74,379 | 44.46% | 16,292 | 9.74% | 1,929 | 1.15% | 167,301 |
Analysis
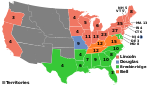
Virginia was one of only three states to vote for the Constitutional Union candidate, former U.S. Senator John Bell, over the Southern Democratic candidate, Vice President John C. Breckinridge, and the Democratic candidate, U.S. Senator Stephen A. Douglas. Former U.S. Representative Abraham Lincoln was also the Republican candidate in this election, but he received the lowest support for any Republican presidential candidate (as well as the lowest support of any candidate who won the presidency) in the history of Virginia.
This was the first presidential election since the formation of political parties in which Virginia did not vote for the Democratic or Democratic-Republican candidate. It was also the closest presidential election result in Virginia history: Bell won by 156 votes, or a margin of 0.093474% – the thirteenth-closest statewide presidential result in United States history and the closest between 1836 and 1876. Virginia eventually seceded from the United States on April 17, 1861, and did not participate in the following elections in 1864 and 1868. However, unionist counties in the Ohio basin, plus a number of adjacent counties in the northwest, seceded to form the state of West Virginia and did participate in those two elections. As of the 2020 presidential election[update], this is the last election in which Morgan County, one of the counties that broke off to form West Virginia, did not vote for the Republican candidate.
Virginia was the only one of the eleven states that would later declare their secession from the Union and be controlled by Confederate armies where any ballots for Lincoln were distributed, and the vast majority of the votes Lincoln received were cast in border counties of what would soon become West Virginia – the future state accounted for 1,832 of Lincoln's 1,929 votes.[7] Lincoln received no votes at all in 121 of the state's then-145 counties (including 31 of the 50 that would form West Virginia), received a single vote in three counties and received ten or fewer votes in nine of the 24 counties where he polled votes. Lincoln's best results, by far, were in the four counties that comprised the state's northern panhandle, a region which had long felt alienated from Richmond and which was economically and culturally linked to its neighbors Ohio and Pennsylvania and which would become the key driver in the successful effort to form a separate state. Hancock County (Virginia's northernmost at the time) returned Lincoln's best result – he polled over 40% of the vote there and finished in second place (Lincoln polled only eight votes fewer than Breckinridge). Of the 97 votes cast for Lincoln in the state's post-1863 boundaries, 93 were polled in four counties along the Potomac River and four were cast in the coastal city of Portsmouth.
See also
Notes
- ^ The official return from Wyoming County was received in Richmond after the legal deadline for submission of returns and so was not counted in the totals.
References
Works cited
- Abbott, Richard (1986). The Republican Party and the South, 1855-1877: The First Southern Strategy. University of North Carolina Press. ISBN 0807816809.
- Lowe, Richard (1973). "The Republican Party in Antebellum Virginia, 1856-1860". The Virginia Magazine of History and Biography. 81 (3). Virginia Historical Society: 259–79. doi:10.2307/4247810. JSTOR 4247810.
State results of the 1860 U.S. presidential election | ||
|---|---|---|
|  | |


